XRP is losing ground against Bitcoin on the weekly chart, and the setup heading into this weekend could define the pair’s direction for weeks. A failed retest of a key resistance zone on the XRP/BTC weekly timeframe has raised the possibility of a 64% decline if bearish structure confirms, according to analysis published by U.Today on March 21, 2026.
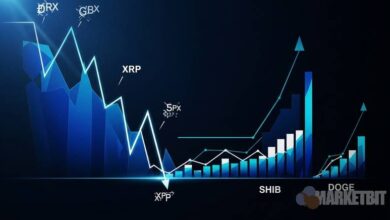
The analysis centers on a TradingView chart of the XRPBTC pair on Binance, captured on the weekly timeframe on March 20. At the time of the snapshot, XRP/BTC was trading near 0.00002056, sitting below higher moving-average ribbon levels around 0.00002182 and 0.00002301.
That positioning matters. When price trades below key moving averages on a weekly chart, it signals sustained weakness rather than a short-term dip. The pair’s current level near 0.00002048 on Binance spot data confirms that XRP continues to bleed value relative to Bitcoin heading into the weekend.
Why the XRP/BTC Retest Matters Right Now
This analysis is not about XRP priced in dollars. It is about XRP priced in Bitcoin, a measure that strips out broader market moves and isolates how capital is flowing between the two assets. When XRP/BTC falls, it means Bitcoin is absorbing relative strength at XRP’s expense.
A retest, in technical terms, occurs when price returns to a level it previously broke through. If that level held as support before the breakdown, it often flips into resistance on the retest. Traders watch for rejection at these levels because a failed retest, where price touches the zone and gets pushed back down, is one of the strongest confirmation signals in chart analysis.
The weekend timing adds weight. Crypto markets trade continuously, but weekly candles close on Sunday night UTC. A weekly close below the contested zone would print a confirmed rejection on the highest-conviction timeframe that most swing traders reference. That is why the next 48 to 72 hours carry outsized importance for the XRP/BTC pair.
This kind of relative weakness has surfaced before in altcoin markets. Traders who followed recent XRP level analysis and resistance tests will recognize the pattern: altcoins that fail key retests against Bitcoin tend to underperform for extended periods afterward.
How a Failed Retest Could Confirm Bearish Structure
The bearish thesis rests on a straightforward mechanic. If a level that once acted as support now acts as resistance, the market has structurally shifted. Buyers who previously defended that zone are no longer present, and sellers have taken control.
For XRP/BTC, the setup suggests that the pair broke below a significant support band and is now retesting it from underneath. A rejection here would confirm a support-to-resistance flip, one of the most reliable patterns in technical analysis across all asset classes.
The broader context reinforces the bearish read. The recent resilience of Bitcoin near major price levels while altcoins struggle points to a capital rotation dynamic. When Bitcoin dominance rises, it typically means traders are consolidating positions into BTC and exiting altcoin exposure, exactly the behavior that drives XRP/BTC lower.
Confirmation requires more than a brief touch of the level. The pair would need to approach the resistance zone and get firmly rejected, ideally closing the weekly candle well below it. A brief wick into the zone followed by a sharp reversal down would be the clearest signal that sellers are in control.
Current sentiment data adds another layer. The crypto Fear and Greed Index sits at 12, deep in “Extreme Fear” territory. Risk-off environments tend to accelerate capital rotation into Bitcoin and away from higher-beta altcoins like XRP. Exchange inflows for altcoins, including tokens like Shiba Inu which recently saw a surge in exchange deposits, suggest that holders are moving coins to exchanges, often a precursor to selling pressure.
What a 64% Decline Scenario Would Mean for Traders
The U.Today analysis projects a potential downside target of 0.00000722 BTC if the failed retest confirms. From the current level near 0.00002048, that represents roughly a 64% decline in XRP’s Bitcoin-denominated value.
It is important to frame this correctly. The 64% figure is a scenario-based projection tied to a specific technical trigger, not a forecast. If the retest fails and bearish structure confirms, the next significant support zone on the weekly chart sits at that lower level. It does not mean XRP will drop 64% overnight or that the move is guaranteed.
In dollar terms, XRP currently trades near $1.45 with a market cap around $88.9 billion. A 64% decline against Bitcoin would not necessarily translate to a 64% drop in USD price, since Bitcoin’s own price movement would factor into the equation. However, sustained underperformance against BTC historically correlates with weaker USD performance for altcoins during risk-off periods.
Traders managing XRP positions should understand what would invalidate the bearish case. The simplest invalidation signal would be XRP/BTC reclaiming and holding above the retest zone on a weekly closing basis. If the pair pushes through resistance and holds above the moving-average ribbon near 0.00002182, the failed-retest thesis breaks down and the bearish structure would need to be reassessed.
The 24-hour trading volume for XRP sits near $1.66 billion, indicating sufficient liquidity for the pair to make a decisive move in either direction. Whether that move confirms the bearish thesis or invalidates it will likely come down to how Sunday’s weekly candle closes.
One thing the analysis does not provide is independent confirmation of the 0.00000722 BTC support target from a second source. The downside projection originates from the U.Today piece, and no separately attributable analyst note marking that specific level was identified. Traders should treat the target as one technical read among many rather than consensus.
With the broader altcoin market showing mixed signals and Bitcoin continuing to attract defensive capital, the XRP/BTC pair’s weekend close will be closely watched. The setup is clear: hold above resistance and the bearish case weakens, reject and close below it and the path to significantly lower levels opens up.
Disclaimer: This article is for informational purposes only and does not constitute financial or investment advice. Cryptocurrency and digital asset markets carry significant risk. Always do your own research before making decisions.